Nx Witness User Manual
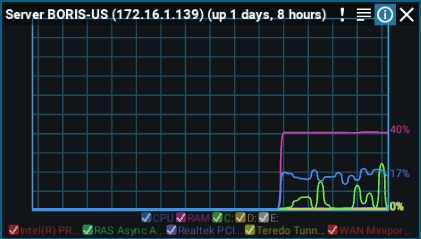
Nx Witness provides a real time Server Health Monitor display that can be added to layouts, opened in separate tabs or a new window.
Access to System Health Monitors is granted to all Built-In Groups. The Built-In Group System Health Monitor is configured to only allow viewing of System Health Monitors and notifications. Custom Groups can be granted access to System Health Monitors by using the Permission Resource control or adding the System Health Monitor Group as a member of the Custom Group.
To Monitor Server Health in the Desktop Client
•Click-and-drag the Server from the Resource Panel into a new or existing layout.
•Open the Server context menu and choose Monitor, Monitor in New Tab, or Monitor in New Window to open the monitor.
oMultiple Servers can be selected at once by using CTRL+Click to select before opening as previously described.

The following traces are displayed by default and can be toggled off and on by clicking the checkbox in the legend at the bottom of the display:
•CPU load.
•RAM memory usage.
•Hard disk partition usage (for example, C: and D:).
•Network interfaces usage.
The following details can be toggled to always be displayed by clicking the (i) icon in the upper right corner of the graph or by opening the graph context menu and selecting Show on Item > Info:
•Server name and current up-time since Server was last re/started.
•Percentage of capability being used displayed on the right side.
•Legends and chart color key.
To Monitor Server Health in Web Admin or Cloud Portal
1.Connect to the Server
2.Select Monitoring from the header menu
3.Choose to view the Graph or Log
 Note: Review the "Health Monitoring" topic for additional options to monitor the performance of System components.